|
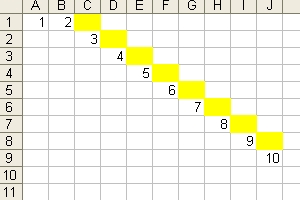
The disease starts at day 1 with person #1. Each person spreads the disease to 1 person. Each person goes into qaurantaine after 1 day and then spreading caused by that person stops.
|
Each row in the spread sheet shows the situation for one patient by patient number: When infected, by which patient and which patient is infected and the day when in quarantaine.
For example: patient #2, shown in row #2, is infected by patient #1 at day #2, infects patient #3 at day #3 and goes into quarantaine the same day (As indicated by the yellow square).
See next example for a better explanation.
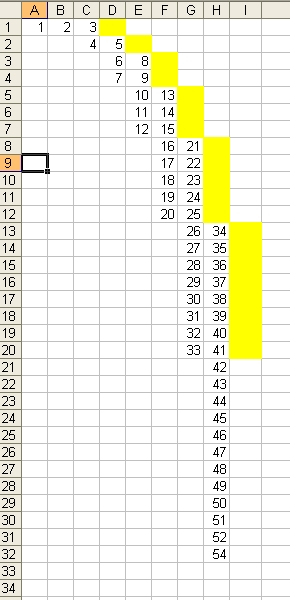
3. Example 2 - 2 days
- At day 2 person #2 will be infected by person #1. Nobody will go into quarantaine.
- At day 3: #3 will be infected by #1, #4 will be infected by #2.
Person #1 will go into quarantaine. This is indicated by the yellow square. - At day 4: #5 will be infected by #2, #6 by #3, #7 by #4.
Persons #2 will go into quarantaine. - At day 5: #8 will be infected by #3, #9 by #4, #10 by #5. #11 by #6. #12 by #7.
Persons #3, and #4 will go into quarantaine. - At day 6: #13 by #5, #14 by #6, #15 by #7, #16 by #8, #17 by #9, #18 by #10, #19 by #11 and #20 by #12
Persons #5, #6 and #7 will go into quarantaine. - At day 7: #21 will be infected by #8, #22 by #9, #23 by #10, #24 by #11, #25 by #12, #26 by #13, #27 by #14, #28 by #15, #29 by #16, #30 by #17, #31 by #18, #32 by #19 and #33 by #20, Persons #8, #9 #10 #11 and #12 will go into quarantaine.
- patient #2, shown in row #2, is infected by patient #1 at day #2, infects patient #3 at day #3, infects patient #4 at day #4,and goes into quarantaine the same day (As indicated by the yellow square).
|
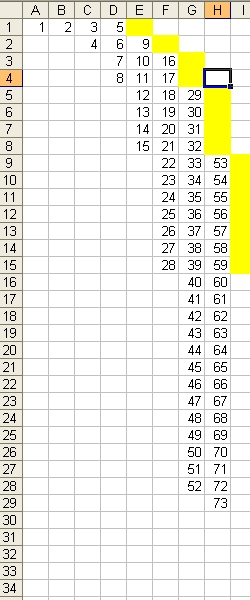
The disease starts at day 1 with person #1. Each person spreads the disease to 1 person/per day. Each person goes into qaurantaine after 2 days and then spreading caused by that person stops.
|
4. Example 3 - 3 days
- At day 2 person #2 will be infected by person #1. Nobody will go into quarantaine.
- At day 3: #3 will be infected by #1, #4 will be infected by #2. Nobody will go into quarantaine.
- At day 4: #5 will be infected by #1, #6 by #2, #7 by #3, #8 by #4. Person #1 will go into quarantaine.
- At day 5: #9 will be infected by #2, #10 by #3, #11 by #4, #12 by #5, #13 by #6, #14 by #7, #15 by #8.
Person #2 will go into quarantaine. - At day 6: #16 by #3, #17 by #4, #18 by #5, #19 by #6, #20 by #7, #21 by #8, #22 by #9, #23 by #10, #24 by #11, #25 by #12, #26 by #13, #27 by #14 and #28 by #15
Persons #3, #4 will go into quarantaine. - At day 7: #29 will be infected by #5, #30 by #6, #31 by #7, #32 by #8, #33 by #9, #34 by #10, #35 by #11, #36 by #12, #37 by #13, #38 by #14, #39 by #15, #40 by #16, #41 by #17, #42 by #18 ... #52 by #28 Persons #5, #6, #7 and #8 will go into quarantaine.
- At day 8: #21 will be infected by #8, #22 by #9, #23 by #10, #24 by #11, #25 by #12, #26 by #13, #27 by #14, #28 by #15, #29 by #16, #30 by #17, #31 by #18, #32 by #19 and #33 by #20, Persons #9, #10 #11 #12 #13, #14, and #15 will go into quarantaine.
- Total Active infections= Total Infections - Total quarantaine
|
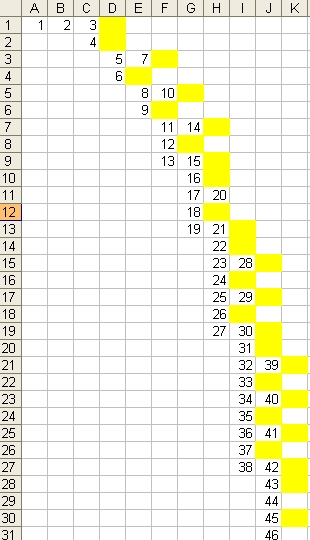
The disease starts at day 1 with person #1. Each person spreads the disease to 1 person. Each person goes into qaurantaine after 3 days and then spreading stops.
|
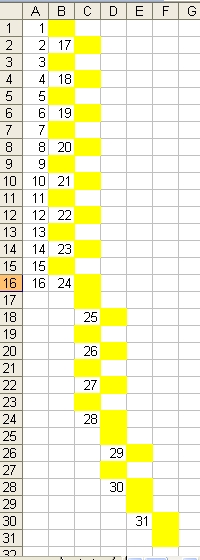
5. Example 4 - 1.5 days
|
|
6. Example 5 - 0.5 days.
- The simulation start with 16 patients.
- During day 1, 8 patients go into quarantaine. This are the patients #1,#3,#5,#7,#9,#11,#13 and #15. That is why at the end of the day there are 16-8 = 8 active infections. The other 8 patients give one infection (the next day), that on average 1 infection for every 2 days.
- It is important to emphasize that this is on average 1 infection for each 2 days and not every 0.5 days, because that is misleading. As such we should also not mention an average of 0.1 days but: on average 1 infection every 10 days
|
|
Reflection - General Conclusion
-
The most important means to eradicate the corona virus is to detect as fast as possible every one who has the disease (or has a high chance to get the disease) and to bring these people in quarantaine or in a hospital.
Created: 23 April 2020
Back to my home page Contents of This Document